A project may look profitable at the quote stage but lose its margin over the course of calls, travel, forgotten hours, and last-minute purchases. Profitability indicators for service projects serve to identify this gap while the work is in progress, not three weeks after the invoice is sent. For an SME managing work orders, mandates, or field interventions, this visibility can make the difference between a busy team and a truly profitable company.
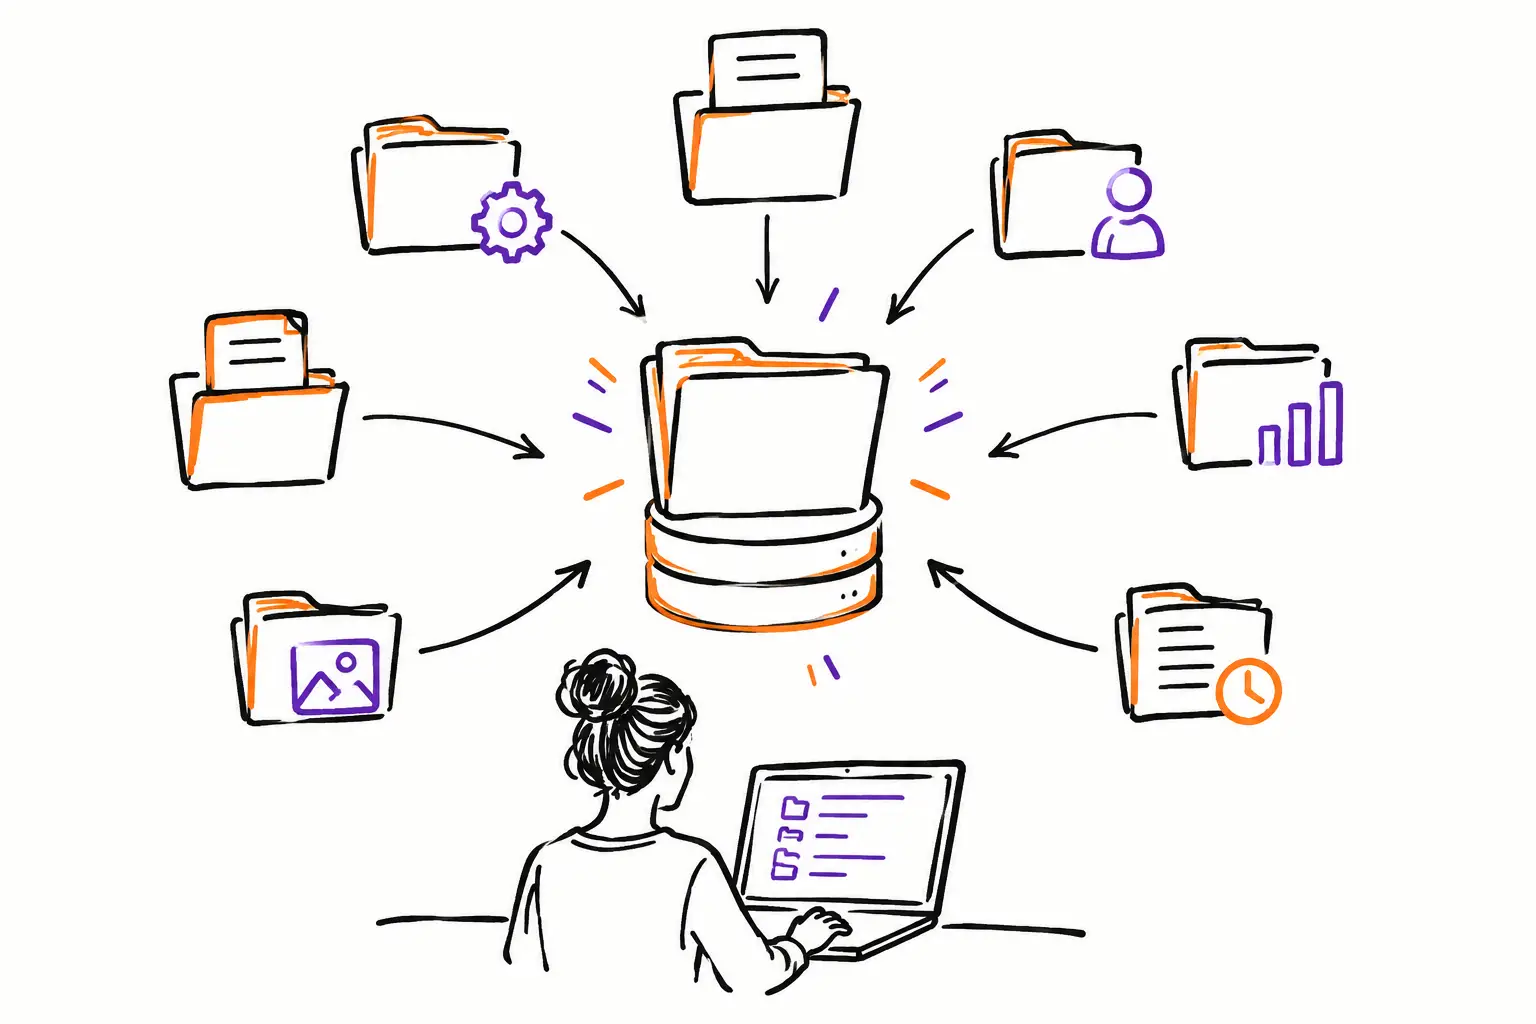
The problem is not a lack of data. Hours are in an Excel sheet, expenses are in accounting, photos are on a technician's phone, and requested changes are in an email. When this information is not linked to the same work file, the manager must reconstruct the project's history by hand. They see the real cost too late, often once the margin has already vanished.
Profitability indicators for service projects to track
There is no single indicator that answers every question. An excavation company, a specialized workshop, and a technical services firm do not have the same direct costs or the same billing cycle. However, every manager must be able to quickly answer three questions: how much the project was supposed to earn, how much it has cost so far, and what remains to be billed.
Planned gross margin vs. actual gross margin
The planned gross margin is calculated from the quote: the sold amount minus estimated direct costs. These costs generally include labor hours, materials, subcontracting, equipment rental, and expenses directly attributable to the mandate.
The actual gross margin uses the same categories but with data entered during execution. If a mandate sold for $10,000 was supposed to cost $6,500, its planned margin is $3,500, or 35%. If the actual costs rise to $8,000 without a billable adjustment, the margin drops to 20%. The invoiced amount does not change, but the profitability has changed in a very concrete way.
The margin percentage is useful for comparing projects of different sizes. The margin amount is just as useful: a 5% drop does not have the same effect on a small service call as it does on a $100,000 construction site. Track both, and look at them by type of service, client, team, or project manager when your volume allows.
The gap between budget and actuals
The budget variance shows where the project deviates from what was sold. You must separate hours, materials, equipment, and subcontracting. An overall variance warns you that there is a problem. A variance by item helps you take action.
For example, a project may respect its material budget but exceed the planned time by 18 hours. Is it a poor initial estimate, an ill-adapted procedure, rework caused by missing information, or an additional request from the client? Without this reading, you risk asking the team to "work faster" when the problem stems from the quote or the preparation.
The variance must be visible before the file is closed. A simple threshold can suffice: at 70% of the consumed hour budget, the manager receives an alert or validates the remaining work. This is not unnecessary surveillance. It is an opportunity to confirm the scope, obtain approval for additional work, or reorganize the intervention before working for free.
Logged hours, billable hours, and invoiced hours
In services, labor is often the most significant and poorly captured cost. A timesheet submitted the following Friday does not provide a reliable picture of a job site that changed on Monday. The right indicator therefore starts with a simple fact: hours must be logged at the moment the work is done, directly on the work order, mandate, or project.
Next, distinguish between three things. Logged hours prove activity. Billable hours indicate what can be charged to the client according to the agreement. Invoiced hours confirm what was actually billed. The gap between these three figures quickly reveals revenue leaks.
A non-billable hour is not always a problem. It may correspond to a correction covered by a warranty, training, or a client relationship you choose to maintain. But it must be identified as such. Otherwise, it becomes an invisible loss and distorts the evaluation of your contracts, your teams, and your prices.
Work performed but not yet invoiced
Unbilled work-in-progress is an indicator that is too often ignored. It measures the value of hours, expenses, parts, or milestones already completed that have not yet been converted into an invoice. The more this amount increases, the longer your cash collection waits, even if the teams have done the work.
In a service company, the delay often comes from a fragmented process. The technician finishes the intervention, the work order remains incomplete, a photo is missing, the client hasn't signed, or the office has to re-enter hours into another system. Each handoff adds a risk of oversight and slows down billing.
A complete work file allows you to move from execution to invoice without double entry. Times, expenses, items used, validations, and attachments are already in the same place. The administrative manager doesn't have to guess what was done or chase after information. They verify exceptions and invoice faster.
Linking indicators to the work document
A dashboard corrects nothing if the data feeding it is uncertain. The reliability of indicators depends on the path of information in the field. The best method is often to have each piece of data live in the document the team is already using: quote, work order, ticket, mandate, or project.
The journey becomes clear. The quote establishes the price, quantities, and planned budget. Once accepted, it creates or feeds the work document. The team enters their tasks, hours, materials, expenses, photos, and exchanges with the client. Additional work is added and submitted for approval. At the end, the eligible items move to the invoice.
This continuity is particularly useful when several people are involved. The coordinator sees if hours exceed the budget. The project manager sees the committed expenses. The office sees the files ready to be invoiced. The owner can compare margins by activity without waiting for the end of the month. Everyone consults the same reality, with a level of detail adapted to their role.
Don't just measure team performance
Profitability indicators can quickly become a misused tool of pressure. If a technician takes longer because site access was impossible, because parts were unavailable, or because the scope changed, the problem is not necessarily theirs. A fair reading must preserve the context of the file.
This is why statuses, notes, photos, and validations count as much as the numbers. They explain the variance. They also allow for an essential distinction between an overrun absorbed by the company and an extra that needs to be approved and then invoiced.
After a few weeks, look for repetitions. Do projects of the same type always exceed the hour budget? Do certain clients often ask for informal changes? Does one team invoice fewer materials because inventory outflows are not linked to work orders? These findings serve to adjust your prices, your procedures, and your quoting models, not just to comment on past results.
Getting started without drowning the team in numbers
For an SME, a good start consists of tracking four metrics on each project: planned margin, actual margin to date, hour variance, and unbilled value. If this data is reliable and reviewed weekly, it already provides a much more useful vision than a financial report received too late.
Then, add the details that correspond to your reality: profitability by technician, by territory, by type of intervention, by equipment, or by client. It is not necessary to measure everything from the start. Too many indicators create tables that no one looks at. The best ones are those that trigger a specific decision: requesting an approval, correcting a quote, invoicing a completed file, or reviewing a work method.
Your methods are unique, and your indicators must follow your actual way of delivering service. When the field, the office, and the billing department work from the same document, profitability ceases to be an accounting surprise. It becomes usable information at the moment you can still protect your margin.